If you use HawkSoft you're likely familiar with the automatically generated report dashboards for Agency Intelligence and Sales & Retention, but what if there's a number you're looking for that you don't see there, or something you need more detail on? HawkSoft's Advanced Reports tool allows you to build completely customized reports for virtually any key performance indicator (KPI) your agency wants to track. Because they have so many customizable fields and filters, creating an Advanced Report may seem daunting at first, but if you understand a few basic principles, you’ll see how easy it is to build a report and narrow down to the exact data you need.
This article is part of a series on the six main types of reports in HawkSoft. See our blog on Report Types in HawkSoft for a quick overview of each report—we'll be diving into each one in more detail. This article focuses specifically on Advanced Reports, including how to create, filter, act on, and save and export reports.
In this article:
- When to use Advanced Reports
- Best practices for reporting
- Creating a new report
- Viewing and filtering a report
- Performing bulk actions from a report
- Saving and exporting reports
When to use Advanced Reports
Advanced Reports are one of six main types of reports in HawkSoft. See our blog on Report Types in HawkSoft for an overview of what each type of report is and when you might want to use them.
Advanced Reports is the place to go if you can't find a certain KPI you need in Agency Intelligence or Sales & Retention, or if you need more detail than what's shown there. Advanced Reports lets you create a completely customized report for nearly any type of data saved in HawkSoft. While these reports take a little longer to set up and filter, they can provide detailed data on virtually any information inside HawkSoft.
Here are some of the most common types of reports agencies run using Advanced Reports. See our help article on Common Advanced Reports for walkthroughs of how to set up each of these reports.
- Renewal Report (expiration report)
- Current Active Clients
- Cancelled Policies
- Cancel Pending
- Policies by Company (book of business)
- Production (inception date)
- Birthday
- XDate
- Claims
- Cross Sell
Best practices for reporting
Before you begin running reports, here are some important things to be aware of when working with HawkSoft data.
User Permissions
Because reports can access sensitive agency and client data, user permissions are required to use and create most reports. Make sure your HawkSoft administrator has given you the necessary reporting permissions in HawkSoft before getting started. If you're not sure which permissions you need to run a report, the help article for each report shows the necessary user permissions for that report.
Freshen Indexes
If you plan to run reports, make sure you’re running the Freshen Indexes feature regularly. Freshen Indexes functions like a cache clearing feature to make sure any recent changes you’ve made to client files will be reflected in your reports. We recommend running Freshen Indexes at least weekly to ensure your report data is as accurate as possible.
Clean input data
Your reports will only ever be as accurate as the data inside HawkSoft. If you’re inputting data incorrectly or inconsistently, your reports will also be incorrect. See our blog on Report Types & Best Practices in HawkSoft for a list of the input fields that have the greatest effect on reports in HawkSoft, and for more resources on database cleanup.
Creating a new report
To create a new report, go to Reports > Advanced Reports and select New Report. Below are each of the report setup screens you’ll go through in order to create the report.
Policy Type
The initial screen allows you to select whether you want to include all policy types or only specific types, as well as select whether you want to include active or inactive policies. The Report By options allow you to select how line items appear—for example, if you choose Policy here you will see one line item for each policy, but if you select Client, you will see one line item for each client.
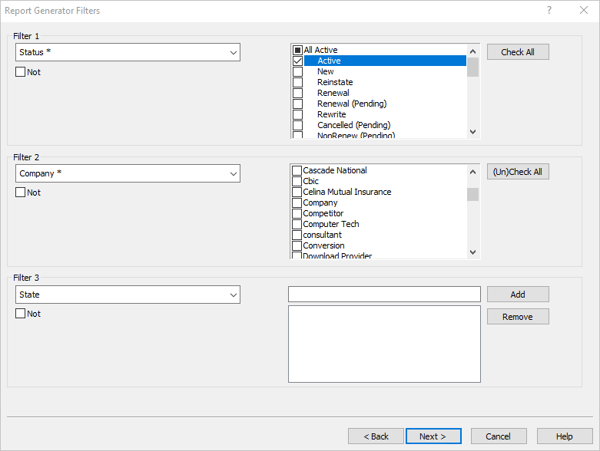
Filters
The Filters screen is where you’ll select which specific fields you’d like to use as filters for the report, such as Policy Status, Policy Company, or LOB. You can also select subcategories for each filter if you want to drill even deeper. For example, you could add filters for Status (All Active), Company (choose a specific company), and Agent (choose a specific agent) to see all policies an agent currently has with a specific carrier.
While you can add up to 6 different filters, we suggest starting with as few filters as possible. It’s easy to filter results further using the Summarize feature once you’ve created the report, but if you add too many filters in the beginning you run the risk of accidentally excluding necessary data from the report.
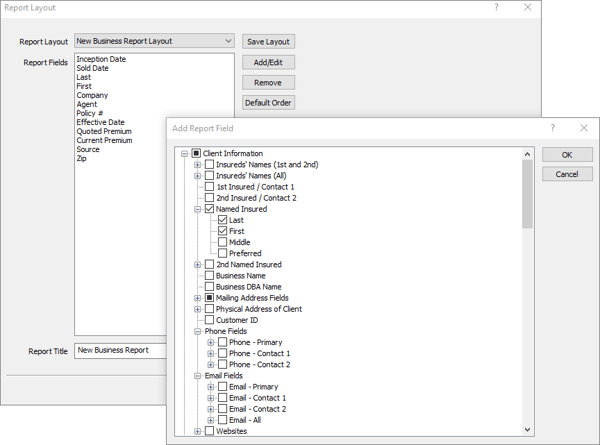
Report Layout
The Report Layout screen shows you which columns will display for your report. You can drag and drop to reorder the columns, or click Add/Edit to add or remove more fields. If there’s a customized layout you want to use across several reports, you can click the Save Layout button to name and save the layout so it will appear in the Report Layout dropdown when you create reports in the future. This is where you’ll name the report as well.
Like with filters, you might want to stick with the default columns at first, unless you have a specific idea of what data you want to see. You’ll be able to adjust the layout further once the report is created.
More on Advanced Report setup: Advanced Customized Reports help article
Viewing and filtering a report
Once the report is created, there are many options for customizing the report view, drilling down to specific segments of the report, and performing actions based on the report.
The display options here function similarly to an Excel spreadsheet. You can click and drag to adjust the widths of the column, or select a column header and drag it to move the entire column. Clicking any column header will sort the report by that column (e.g. click Last Name to sort alphabetically beginning with A, or click again to sort beginning with Z). The filter bar at the top of the report allows you to search any column for a specific line item.
You can double click any line item to pull up the client or policy, or select multiple line items, right click, and select New Report from Selected Entries to open a new report tab with only those items.
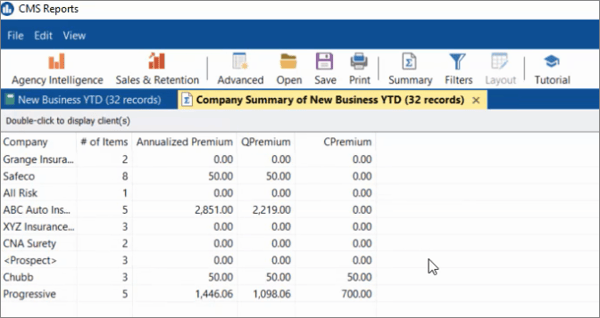
Summarize
One of the most useful features in Advanced Reports is the Summary button, which lets you choose ways to group the report so you can view subsets of the data. For example, you could choose to summarize policies by source to see which sources are generating the most premium. This would show you the total number of line items for each source type within the report, and you can click into any individual source to open a new report tab showing only the items from that source. You can continue to summarize multiple times within a report to narrow down to as small a data set as you’d like.
Summarizing your report is one of the easiest ways to filter your report down to the most relevant results. As stated earlier, it’s best to create the report with as few filters as possible to maximize the results available in the report, and then use the Summary button to narrow down to the specific slice of data you’re looking for.
Note: You can only summarize a report using fields that are already included in the report layout, so if you can’t find a field in the Summarize menu, you’ll need to add it to the report layout first.
Filters & Layout
The Filters and Layout buttons in the menu bar allow you to adjust the filters and layout of the report using the same screens you did originally. If you don’t see the results you were expecting, you can adjust the filters, and if you want to add or remove columns of data, you can adjust the layout.
More on viewing and filtering reports: Working with Report Data help article
Performing bulk actions from a report
Once you have the exact list you want in a report tab, there are several types of bulk actions you can perform on the list. These options are available under the File menu. This makes it easy to take action on a group of clients or policies without leaving the report screen.
- Send Email: Send a batch email to the list using a correspondence template
- Create Batch Log: Add a log note to all the clients or policies on the list
- Print: Create envelopes, form letters, invoices, or statements from the list
Saving and exporting reports
Once you’ve filtered and formatted your report to perfection, there are several ways you can save the report for later use. Creating a Saved or Memorized report allows you to open the report again in HawkSoft so that you can drill down into individual clients and policies, while exporting the report allows you to view the report in another format, like Excel.
Saved vs. Memorized reports
There are two ways to save your report: as a Saved Report or a Memorized Report. A Saved Report is a snapshot of the report at the exact point in time you ran it. When you open a Saved Report, you are not running the report again, but simply opening the exact same data you saved earlier. A Memorized Report is a saved template of the report filters and layout you selected. When you open a Memorized Report it will run a new report, showing you the most current data for the report parameters you specified.
In short, if you want to create a report you will run on a recurring basis, you should save it as a Memorized Report. If you’re creating a specific list for a certain point in time that you want to remain unchanged each time you open it, you should save it as a Saved Report. See our help articles on Saved Reports and Memorized Reports for more details on each type of report.
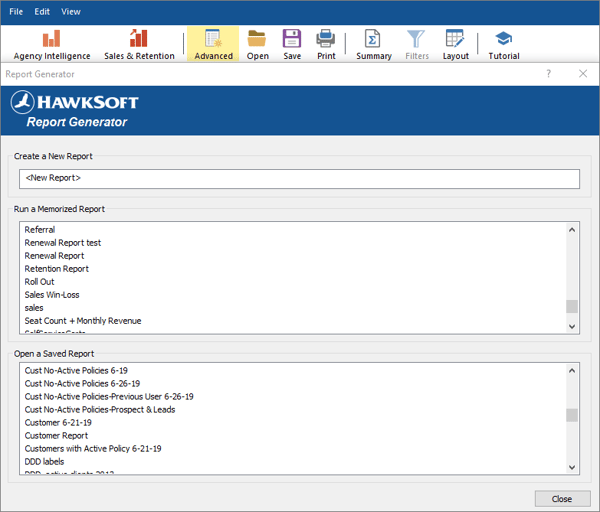
Using File > Save As will create a Saved Report. To save the report as a Memorized Report, use File > Save Memorized Report. After you’ve saved your report, the next time you open Advanced Reports your new report will appear in either the Memorized Reports or Saved Reports section of the Report Generator window.
Exporting reports
Select File > Export > Report to export the report as a CSV that can be opened in Excel (remember to select CSV in the Save as type dropdown). You can also select to export customers to Quickbooks, or to export policies as ACORD AL3s or ACORD XML (Auto and Home policies only).
More Advanced Reporting resources
Once you understand the basics of creating customized Advanced Reports, you can get analytics on virtually any data that’s entered into HawkSoft. Need some ideas? Watch the HUG Fall Workshop on reporting, where Sean Hawkins (HawkSoft) and Stephen Harrington (HUG) walk through how to build some of their favorite reports. Plus, here are some more great resources on Advanced Reports:
- Help system: Advanced Reports
- Training Videos: Help > Training Videos > Advanced Learning Path > Advanced Reporting