Does the word "reporting" send chills down your spine? Does your stomach turn at the thought of sifting through pages of data just to get a sense of how your agency's book of business is doing? Fortunately, in HawkSoft you don't have to dig deep into an abyss of data to find the meaningful agency metrics. HawkSoft's Agency Intelligence and Sales & Retention reports offer the detailed data of a comprehensive report in the automated, easily digestible format of a dashboard for your agency.
That means no need to "pull" reports for key performance indicators (KPIs) for your agency. In Agency Intelligence and Sales & Retention, all the important numbers are automatically displayed, and you can click into any KPI to dig into specific data or filter into subsets.
This is an overview of how to use Agency Intelligence and Sales & Retention reports, and which KPIs they each show. For information on other types of reports in HawkSoft, see our blog on Report Types & Best Practices in HawkSoft.
This article at a glance:
- Using Agency Intelligence and Sales & Retention
- Before you start
- Navigating the reports
- Report tools
- Agency Intelligence KPIs
- Customer KPIs
- Policy KPIs
- Sales & Retention KPIs
- Sales Pipeline
- Renewals
- Digging deeper with reporting
- Reporting Resources
Using Agency Intelligence and Sales & Retention
If you're looking for a certain report or data in HawkSoft, always check to see if it's in Agency Intelligence or Sales & Retention before re-inventing the wheel. Many of the top things agencies want to look at can be found in these reports, including things like:
- Total customers, and customers added and lost in the last year
- Policies and premium per customer
- Customer lifetime and retention rate
- Total policies and premium in force, and premium per policy
- Policies sold, added, and lost in the last year
- Policies that can be cross-sold Auto, Home, or Personal Umbrella
- Policies coming up for renewal in the next 60 days
- Total policies in each Status in the sales pipeline
Before you start
In order to access Agency Intelligence and Sales & Retention, you'll need to have the correct User Permissions set (Advanced Reports > Agency Intelligence). You may need to ask you agency admin to set this permission for you.
It's also important to understand that the data shown in these reports is completely dependent on how data is entered into HawkSoft. See our article on Reporting Best Practices for information on how to ensure that your data is clean and will reflect accurately in reports.
Navigating the reports
Agency Intelligence and Sales & Retention have the same format, so we'll discuss them together. To get started with these reports, just select a category or subcategory on the left side of the screen to open a detailed view on the right, in both table and bar graph or pie chart format. You can double click on any of the numbers in the table to open a list of those specific policies or clients in a report view, allowing you to drill down to individual policies or clients.
Remember that the data shown here displays only current customer and policy data, and includes all data that has ever been entered into HawkSoft (not limited by a date range unless noted). You can select filters above the data on the right in order to refine the report.
Report tools
There are a number of features inside the reports that can help you manipulate data or better understand what's being displayed. These are available in the toolbar at the top of the report and in the area directly above the data table on the right side of the screen.
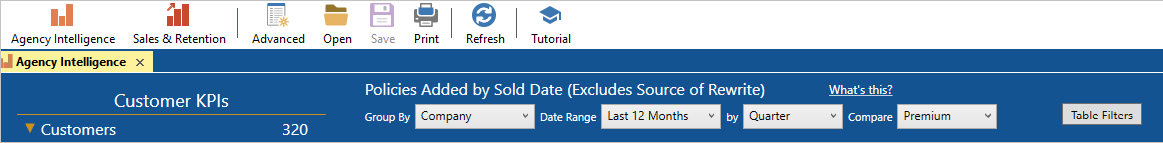
Agency Intelligence menu bar and filters
Filters
Once you select a category, you can use the filter bars to select a specific date range for the data, as well as group it by categories like application type (personal or commercial), office, agent, etc. You can also choose whether you want to compare by number of policies, clients, or premium amount.
There is also a Table Filters button on the far right of the filter bar that allows you to select only certain rows to display, if for example you want to print individual reports for your producers on their personal KPIs. Just remember that if you switch between KPIs, you’ll have to set the filters for each one.
Tutorial & What’s This?
If you ever have questions about the data you’re seeing for any selected KPI, you can click the What’s this? link above the data table on the right side of the screen. This will open a help article explaining exactly how the KPI is calculated, what you can use the report for, and how to run the report as an Advanced Report if you need more report customization options.
There’s also a Tutorial button in the menu bar that will open a walkthrough of the different areas of the report and how to use them.
Refresh button
Because the numbers shown in Agency Intelligence and Sales & Retention are real-time, if you're in a report for an extended amount of time you can hit the Refresh button to reload the report and include any changes that might have been made in HawkSoft since you opened the report.
Print, Export, or Send Reports
Once you’ve filtered an Agency Intelligence or Sales & Retention report the way you want it, you can click the Print button in the menu bar. From here a preview of the report will be generated. You can click Print to print the report; Export to export it as a PDF, Excel file, or image; or Send to email it.
Agency Intelligence KPIs
The Agency Intelligence report shows important KPIs for your agency, broken into two main categories: Customer KPIs and Policy KPIs.
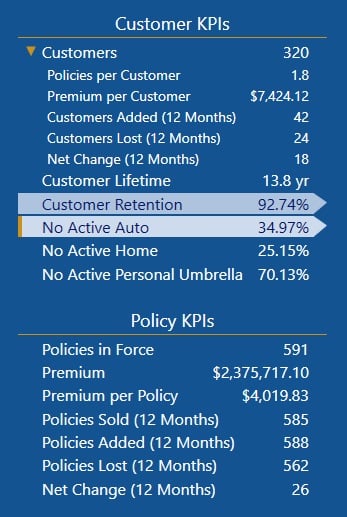
Customer KPIs
Under Customer KPIs you'll see KPIs on your total number of active customers, policies and premium per customer, and and customers added and lost in the last year. Retention KPIs like Customer Lifetime and Customer Retention will give you a good idea of how long customers are staying with you and what percentage of them stay. Cross-selling KPIs show policies with No Active Auto, No Active Home, and No Active Personal Umbrella so you can target customers to sell additional lines to.
Once you select a KPI, you can select to view the results grouped by producer, CSR, or office, as well as select a date range on some. For example, you could select Customers Added and choose to group by Producer to see how many customers each producer added per quarter.
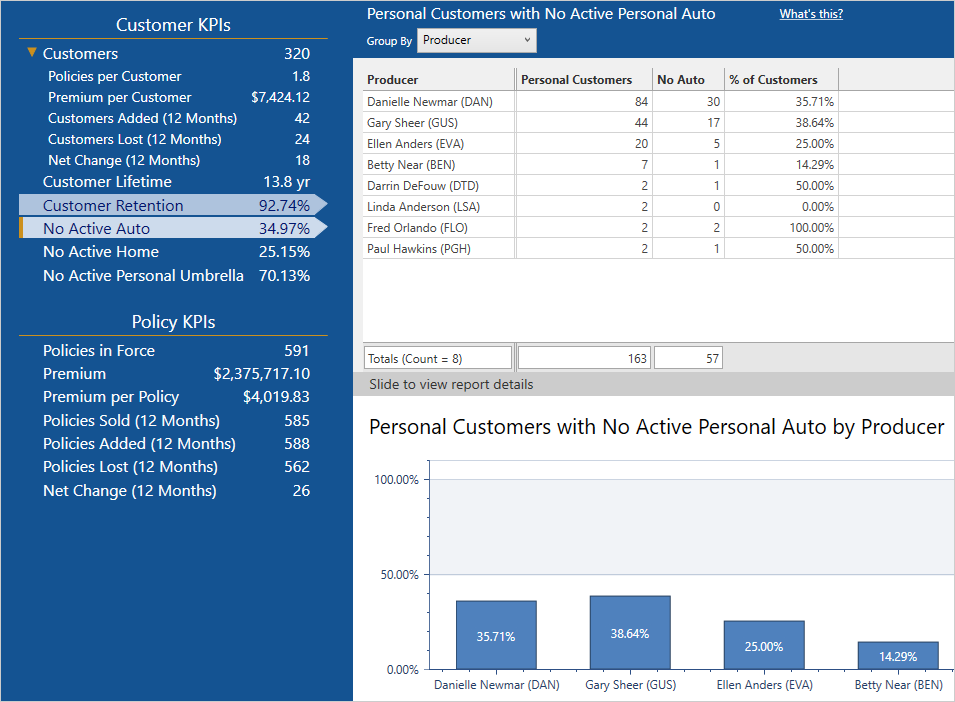
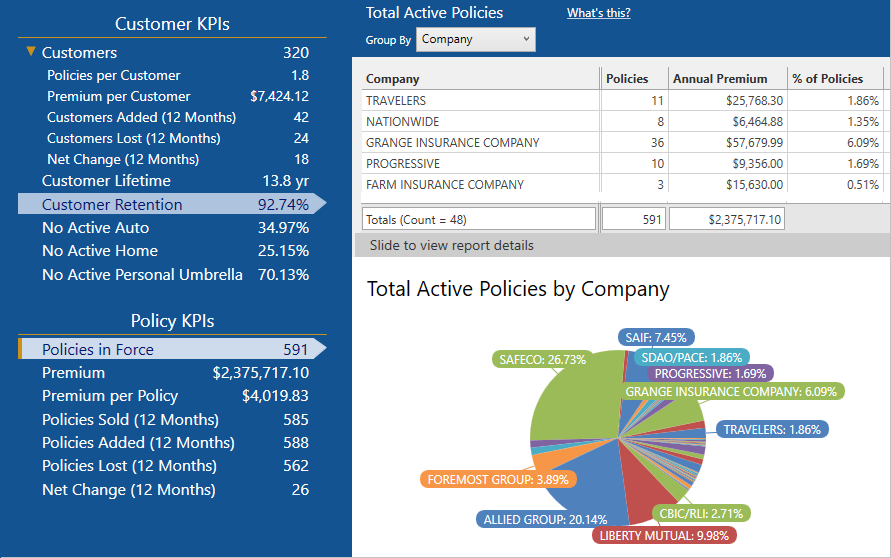
Customer KPIs in Agency Intelligence
Policy KPIs
Under Policy KPIs you'll see numbers by policy rather than customer. You'll see your total number of active policies in force, total premium, and premium per policy, as well as policies sold, added, and lost in the last year.
When you select a policy KPI, you can choose to view results grouped by application type, LOB, Company, or other categories in addition to the options available for customer KPIs. For example, you could select the Premium KPI and choose to group by Company to see what percentage of your total premium comes from each carrier.
Take a look at our Agency Intelligence help article for more details on Agency Intelligence reports.
Sales & Retention KPIs
The Sales & Retention report helps you track how many policies are in each stage of your sales pipeline, as well as policies that are coming up for renewal and those that have cross-sell opportunities.
Sales Pipeline
This part of the report shows policies broken down by Status, or their stage in the Sales Pipeline. This helps you track how many policies are in each status, giving you quick numbers for leads and prospects, as well as those who refused or were rejected. Click on any status to see the substatuses, which can give you more specific KPIs, such as how many policies have been quoted or how many policies were refused based on price.
The Statuses shown here are completely customizable (go to Settings > Customized Lists > Sales Pipeline Substatuses > Edit), and we encourage you to customize your Statuses and Sub-Statuses. The more accurate these are to your agency's process, the better tool the Sales Pipeline report will be to give you a good understanding of your current business at a glance.
See our blog on using the Sales Pipeline to learn more about customizing your Statuses, and hence this report, to most accurately reflect your agency’s process.
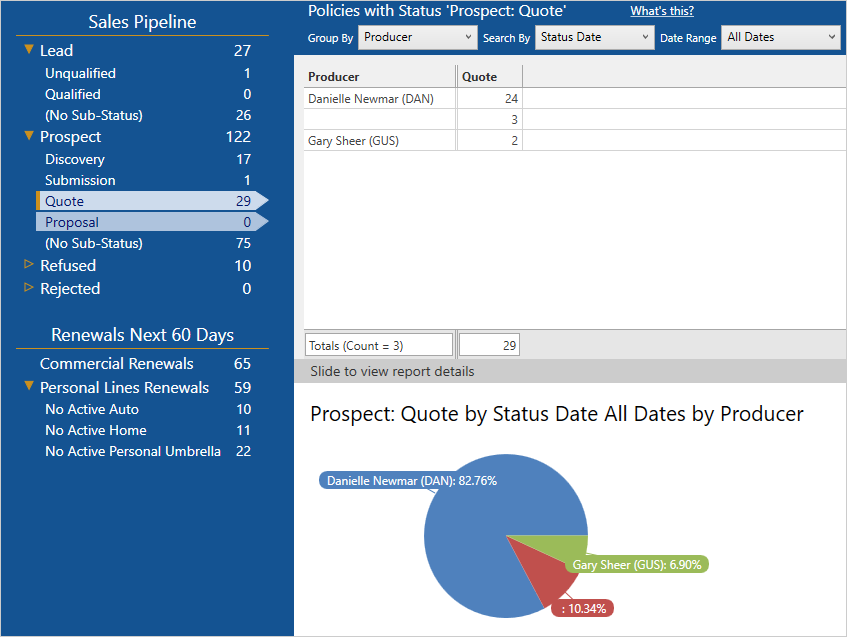
Sales Pipeline KPIs in Sales & Retention
Renewals
This part of the report shows policies that are coming up for renewal within the next 60 days, broken out by commercial and personal lines. It also includes the number of policies that do not have active Auto, Home, or Personal Umbrella policies, allowing you the chance to cross-sell additional policies on renewal. You can use this report to send renewal letters to clients with upcoming renewals.
Learn more about Sales & Retention reports in our Sales & Retention help article.
Digging deeper with reporting
Agency Intelligence provides a quick, high-level overview of your agency's book of business, but it's only the tip of the reporting iceberg in HawkSoft. If you're looking for a specific KPI that you can't find in Agency Intelligence or Sales & Retention, don't worry—you can still get the data you need by creating an Advanced Report, which can be customized to the exact data you want to see. You can get reports on other types of data as well, from logs to suspenses to downloads. See our Report Types article to learn more about what each type of HawkSoft report can tell you.
With the ability to easily check and track your agency's metrics in Agency Intelligence and Sales & Retention, you don't have to guess how your agency's doing—you can confidently set goals, track progress, and drive agency growth.
More reporting resources
- Help system: Agency Intelligence and Sales and Retention
- Blog: Report Types & Best Practices in HawkSoft
- Blog: Drive More Sales with Sales Pipeline
- Webinar: HUG Fall Workshop webinar: Advanced Reports
- Training Videos: Within HawkSoft, go to Help > Training Videos > Advanced Learning Path > Agency Intelligence